Net promotion score to know your customer
Net Promoter® Score (NPS) Survey
Want to know how loyal customers are? Curious to learn if your patients recommend you to others? Looking to make your clients are happy? Calculate your NPS score by asking “The Ultimate Question.” You’ll learn what your customers think—and a whole lot more.
Online NPS surveys
Whether you have patients, employees, or event attendees your Net Promoter Score gives you a quick way to get feedback by asking the ultimate question: “How likely is it that you would recommend this company to a friend or colleague?” If you’ve seen this question before, you’re already familiar with the easiest and fastest way to measure customer loyalty to your company, product, service, or brand.
This Net Promoter Score questionnaire gets you the data you need to quickly understand what customers feel about your organization—and to react to any negative feedback. An NPS score also makes it easy to set both internal performance benchmarks, as well as external benchmarks to compare against competitors in your industry.
SurveyMonkey and NPS
Now you can create your Net Promoter survey, calculate your score, and get context for your results—all in one place. How? SurveyMonkey calculates your Net Promoter Score for you! When you get results from your Net Promoter survey, go to the Analyze section, and you’ll see a gauge that shows your overall Net Promoter Score. You’ll also find a data table with the number (and percentage) of Detractors, Passives, and Promoters among your respondents who are recommending you—and those who aren’t—so you can get the detail around how your NPS was calculated.
Net Promoter® Score Definition and Formula
The Net Promoter Score explained by survey experts.
 Working in marketing often means dealing with math, and the formulas can be mind-bogglingly complicated. At what point in the purchase funnel do you see the greatest amount of conversions? How many clicks on your blog come from organic sources? And at what time do those clicks seem to peak?
Performing all of those calculations can make your head spin. The Net Promoter® Score methodology is refreshingly simple by comparison. Instead of asking hundreds of online survey questions and doing in-depth calculations, you’ll ask one powerful question (and a few refining ones).
Then, you’ll perform just one calculation. And you’ll get an industry standard score, ranging from -100 to +100. (Learn how to do the Net Promoter Score calculation here. Or SurveyMonkey will calculate your NPS for you!)
A quick Net Promoter Score definition
In a standard customer satisfaction survey example, you might ask consumers to give specific feedback on the products and services you provide. Questions like: “How quickly did the customer service team assist you?” can help you understand what consumers really think, and as a result, these questions are very valuable.
And although there are benefits to customer satisfaction versus NPS, these sample survey questions might not provide you with all of the detail you need to improve your business.
Why? Because people who are satisfied might still leave. That’s right. They might appreciate your speed and your products and your price. But, they might be just as willing to switch to another company if they get a better deal. In other words, they may like you, but they may like others more.
The Net Promoter Score Bain developed in 2003 is designed to ask something a lot different. Instead of asking if your customers are happy, you’re asking your customers if they’re promoters of your company. You’re trying to determine if your customers are willing to speak up and speak out about your brand. In essence, you’ll see how many of the people you work with right now are willing to be brand advocates.
The math you do at the end of the questionnaire will provide you with one number that will show you just how many of your consumers are willing to do that advocacy for you. Here’s how it works.
Net Promoter Score methodology
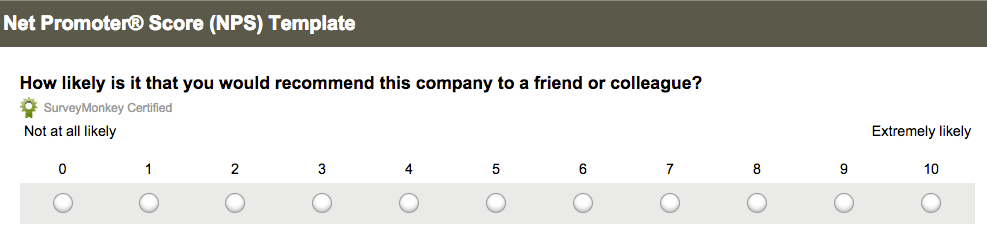
The NPS sample survey starts with one very basic but very powerful basic question: “How likely is it that you would recommend this company to a friend or colleague?”
We’re cutting right to the chase here, asking people straight up if they intend to work as advocates, or if they don’t really plan on spreading the good news about your products or services.
This isn’t a yes/no question, either. Participants are asked to grade their responses on a scale from 0 to 10, with low scores indicating a complete lack of willingness to work as an advocate, and 10 as a very high likelihood of working as an advocate.
The follow-up questions allow you to gather just a bit more data. Here, you’re asking open-ended survey questions that could help you to understand why people are willing to speak up for you, and what might need to change in order to make advocacy more likely. You might ask:
- What changes would this company have to make for you to give it a higher rating?
- What changes would this company have to make for you to give it an even higher rating?
- What does this company do really well?
The open-ended nature of this online poll will give you the data you need in order to push your products, services, or approach in a different direction. But, there’s one more thing you can do with these results in order to help your company. And yes, there is a little math involved.
Working with the numbers
In order to come up with a score, or percentage, of promoters, you’ll return to the answers consumers provided to your original question. Specifically, you’ll be looking at that little 0 to 10 grade they gave your company when asked if they’d promote it. Those grades allow you to segment your consumers into three groups:
- Detractors. These consumers give rankings in the 0 to 6 range. These are the consumers who aren’t willing to speak up for your company at all. In fact, they might be downright hostile to your company.
- Passives. Rankings in the 7 to 8 range put consumers in this category. They might buy from your company on a regular basis, but they might also be willing to switch to someone else, if something better comes along.
- Promoters. Scores of 9 to 10 turn consumers into promoters, and these are the customers all businesses want. They’re loyal, they’re active and they’re willing to share. What could be better?
Once you’ve segmented your respondents into groups, you’re ready for math. Thankfully, it’s pretty easy. A Net Promoter Score definition, in simplest terms, is the percentage of detractors subtracted from the percentage of promoters. You’ll do this by following this simple formula:
(Number of Promoters — Number of Detractors) / (Number of Respondents) x 100
That’s it!
This simple calculation will allow you to see how many consumers are fans of your company, willing to give it a shout out.
The power of the Net Promoter Score explained
The detail you get in follow-up questions will be a key part of the marketing changes you do and do not make for your company. That much is clear. But the numeric score you get after doing a little basic math is intensely powerful. It’s a benchmarkable number you can use, year after year, to track your progress. And, you can even use that number to compare your success with the success of your competitors.
Net Promoter Score definition
What is the Net Promoter Score? The Net Promoter Score definition and formula is based on the following idea:
NPS is a highly regarded loyalty metric that people at companies like yours use to collect the customer feedback they need to inform their business strategy. It's seen by many as a better indicator of customer loyalty than traditional customer satisfaction surveys.
The Net Promoter Score question
The Net Promoter Score methodology is based on asking customers a single question that predicts the likelihood of both repurchase and referral: “How likely is it that you would recommend this company to a friend or colleague?” Customers rate their answers on a scale from 0 to 10.
The answers customers provide are classified as follows:
- 0–6 = Detractors—unhappy customers who can hurt your brand through negative word-of-mouth
- 7–8 = Passives—satisfied but indifferent customers who could be swayed by the competition
- 9–10 = Promoters—loyal customers who will keep buying and referring others
How to get your Net Promoter score
Sending NPS surveys to your customers can be really easy if you make a habit of it. Choose important touchpoints (like when you complete a sale), or send surveys by email on an ongoing basis. You can even automate your NPS surveys. See how we can help.
Why use NPS?
When you ask customers the Net Promoter Score question, you’re essentially asking them whether or not they’re taking the time to say positive things about your company or brand. Because when it comes right down to it, word of mouth is everything—especially today, as opinions spread faster via social channels and online forums and reviews.
Finding out your Net Promoter Score is the easiest way to see how your company is doing in the eyes of your customers. Historically, the positive NPS scores have showed strong correlations to profitable growth. Companies and organizations ranging from small start-ups to some of the world’s largest corporations also use the NPS to assess customer satisfaction and track performance because it’s:
- Simple and quick. One question is all it takes to determine your Net Promoter Score—and it's easy to calculate. With our Net Promoter Score template, you can set up and send your survey in minutes.
- Quantifiable. Management can see how well your company is performing with one simple metric. The NPS introduces common terminologies that are easy to understand by everyone.
- Standardized. Widely known as the standard for measuring and improving customer loyalty, the NPS is trusted by brands like American Express, Apple, GE, JetBlue, and Kaiser Permanente.
- Benchmarkable. One of the most valuable benefits is the ability to see how your organization stacks up against the competition. Because hundreds of companies using NPS, you have a yardstick to measure and track your performance internally and against external NPS benchmarks.
Ways to use NPS
Although there are pros and cons to NPS, getting your NPS helps you understand how you compare against the competition—and find out what the big brands in your industry are scoring.
While you’re continuously monitoring your customer loyalty ratings with NPS to make internal changes to your organization, you can also get external NPS benchmarks to understand if your Net Promoter Score is good or bad.
For example: If your Net Promoter Score is 36, what does that really mean? A score of 36 may not seem great to you. But an NPS of 36 could actually be a strong score when compared with the average Net Promoter Score for organizations in your industry.
With SurveyMonkey Benchmarks, you get context for your Net Promoter Score. Hundreds of companies use our NPS template to measure customer loyalty and improve business outcomes. Our data is diverse, covering everything from small organizations to large corporations and a broad range of industries.
Net Promoter Score calculation
Here are 5 simple steps to calculate your Net Promoter Score:
-
Send the Net Promoter Score Questionnaire to your target demographic.
-
Download your survey responses into an Excel spreadsheet.
-
Within your spreadsheet, identify your respondents as Detractors, Passives and Promoters by adding up the total responses from each classification.
-
Generate the percentage total of each group by taking the group total and dividing it by the total survey responses.
-
Subtract the percentage total of Detractors from the percentage total of Promoters and this is your NPS.
If it makes it easier, the equation for calculating a Net Promoter Score looks like this:
Example: If you received 100 responses to your survey:
10 responses were in the 0–6 range (Detractors)
20 responses were in the 7–8 range (Passives)
70 responses were in the 9–10 range (Promoters)
Calculating the percentages for each group gives you 10%, 20%, and 70% respectively.
Subtract 10% (Detractors) from 70% (Promoters), which equals 60%. Since a Net Promoter Score is always shown as just an integer and not a percentage, your NPS is simply 60.
The history of NPS
Pioneered by Fred Reichheld, author of The Ultimate Question, the NPS is a customer loyalty metric that predicts the likelihood of a customer repurchasing from you or referring your company to a friend. Introduced in 2003, Net Promoter Scores can range from as low as –100 (when every customer is a Detractor) to as high as 100 (when every customer is a Promoter).